Current Location:Home>Product & Technology>Atmospheric Pollution Monitoring>Highly-integrated Environmental Sensing Device (ESD1)
Highly-integrated Environmental Sensing Device (ESD1)
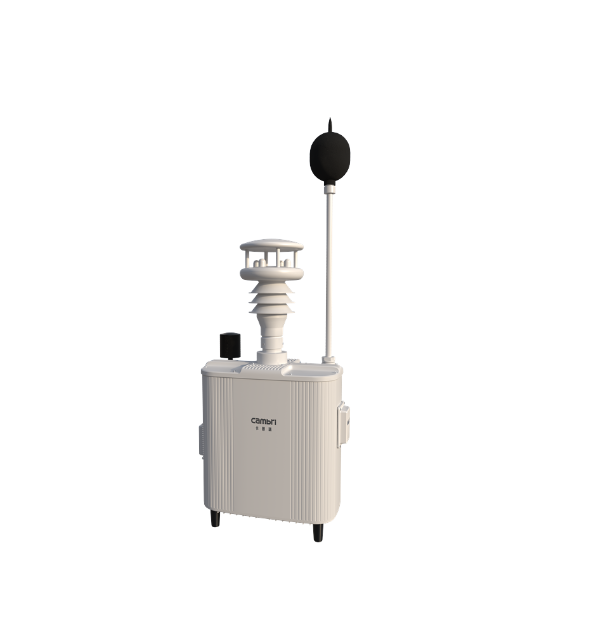
The Cambri ESD1-series is our most advanced, highly-integrated environmental sensing device that adopts an all-sensor route for measuring up to 10 typical air pollutants, 7 meteorological parameters, and environmental noise (Class 1 compliant) simultaneously, achieving a comprehensive measurement of urban atmospheric and noise conditions. Other features include portable size, low power usage, readiness for deployment, and an AI-assisted noise type/source recognition.
The ESD1 series instruments are well-suited for environmental monitoring, including high-density air quality monitoring, community environmental monitoring, supervisory pollution source monitoring, noise monitoring in urban sound functional areas, road traffic noise monitoring, personal exposure monitoring, and contingency monitoring.
The ESD1 series instruments are well-suited for environmental monitoring, including high-density air quality monitoring, community environmental monitoring, supervisory pollution source monitoring, noise monitoring in urban sound functional areas, road traffic noise monitoring, personal exposure monitoring, and contingency monitoring.
- Product Parameters
- Product Quality Control
- Product Advantages


Particulate Matter (PM) Sensor
● In electrochemical gas sensors using liquid electrolytes, gas oxidation/reduction occurs on the liquid-solid interface on electrode surfaces. When ambient temperature and relative humidity change, the interfacial capacitor charges or discharges due to the release or absorption of water vapour by the electrolyte, generating a non-Faradaic current that is unrelated to gas reactions, which appears as though the sensor reading is affected by the fluctuation of environmental conditions (Farquhar et al., ACS Sensors, 6, 1295, 2021). Nowadays, gas sensors reaching a precision of part-per-billion (ppb) level are commercially available, but it has remained a tough issue as to how to remove the temperature and relative humidity related interference signals;
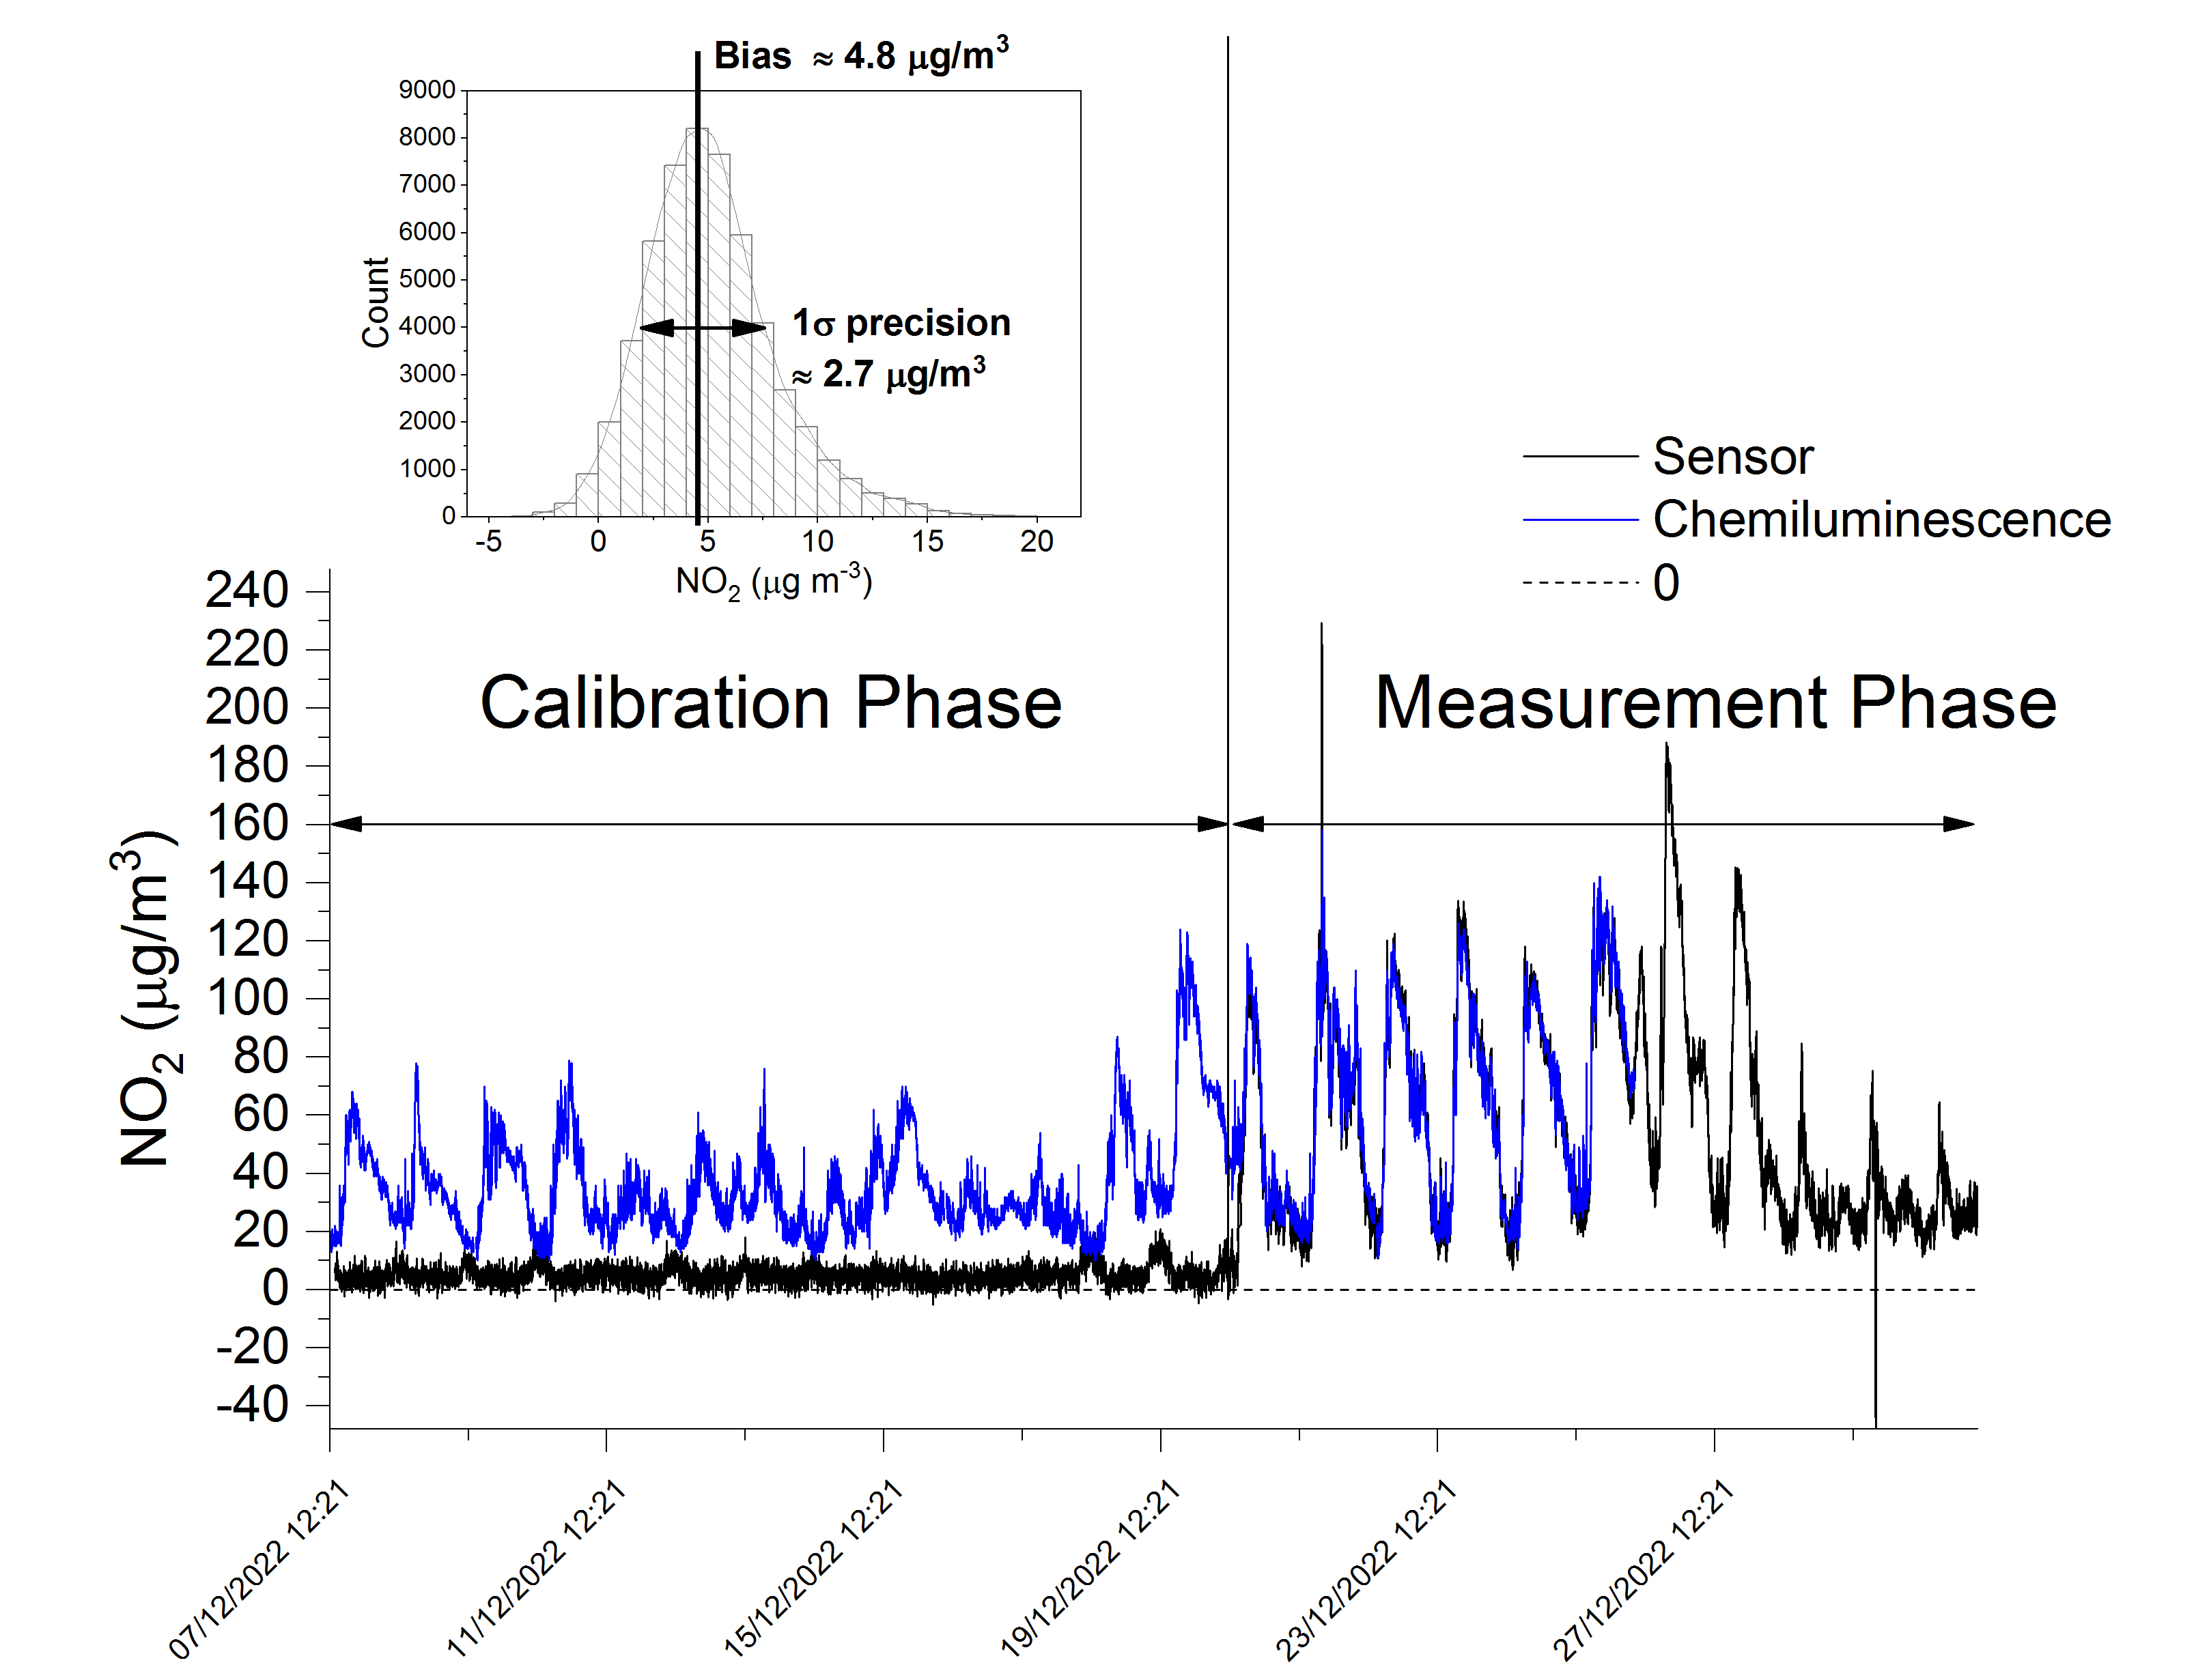
● We have been developing a whole new set of calibration and data quality control method (patented) based on the highly water-permeable perfluoro-sulfonic acid (Nafion) membrane, which allows one to accurately calibrate both the voltage offset as well as response to ambient T and RH remotely and at any time, and furthermore to quantify the residual error after the removal of these effects. As shown in the above figure, the overall reading during the "calibration phase" is close to 0, suggesting that the algorithm adopted (Ouyang, ACS Sensors, 5, 2742, 2020) has performed well in removing the voltage offset and T and RH effects. Moreover, the "1s precision" in the top-left insert graph indicates the overall noise level of the measurement (obtained from the fitting of the histogram of the retrieved gas concentration using a Gaussian envelope during the Calibration Phase), while the "Bias" represents the average deviation of the sensor offset from 0 which ought to be subtracted from later measurements;
● The major advantages of the above approach are:
(1) it offers an objective way of quantifying measurement error of electrochemical gas sensors;
(2) it requires no zero-gas or consumables;
(3) it is possible to calibrate all nodes within the entire network over-the-air, minimizing labour cost during maintenance of quality-control processes.

● The graph above shows the "zeroing" operations of an outdoor device using CO and O3 gas sensors as examples. It can be seen that the retrieved gas concentrations were close to 0 during the zeroing points, suggesting that the T and RH related effects have been largely removed and also that no significant offset was present (further statistical analysis can be applied to explore more quantitative details). Note also that all internal surfaces in contact with ambient gas have been coated with the inert polytetrafluoroethylene (PTFE), in order to minimize surface loss of the more reactive gases such as O3.
Photoionization TVOC Sensor

● Owing to their low noises, TVOC sensors based on the photoionization detection (PID) can have superior sensitivities with their measurement precision reaching down to 1 ppb or lower levels. However, in the field environment, especially that with high relative humidities, raw signals of this type of sensors are often T and RH induced drifts rather than that from VOC photoionization - this is best shown by the grey curve corresponding to the raw signal readings of the "ordinary" PID sensor in the above lower figure, most notably at RH > 80% when the sensor output voltage rose simultaneously and non-linearly with the increase of RH;
● Our patented technique however suppresses the T and RH induced sensor drifts, thereby decoupling the trend of the sensor raw reading and those of T and RH, as shown by the red curver in the above lower figure for the "modified" TVOC sensor;

Furthermore, we compared the TVOC concentration (isobutylene equivalent) measured by the photoionization detector with the weighted concentration of VOC components based on gas chromatography-flame ionization detector (GC-FID) (calculated according to the response coefficients of VOCs to 10.6 eV photoionization, PID Correction Factors), and the results are shown in the figure above.
●Both methods show good consistency in both the low concentration range (10-20 ppb) and the high pollution range (>200 ppb), indicating that the PID sensor can accurately monitor TVOC concentrations in varying outdoor temperature and RH conditions;
● We believe it is fair to claim that measurement results by the PID sensors have effectively eliminated the impacts of T and RH, and therefore can avoid the unrealistic, high reading values under high-humidity conditions. Meanwhile, sensor measurements have higher temporal resolution and can capture VOC concentration change in seconds;
● Our selected sensors have sensitivity loss of <20% after >1 year continous running in the moderately polluted industrial park environment (peak TVOC concentration >400 ppb), suggesting that the sensors are resistant towards pollution and have stable UV lamp outputs across this time scale.
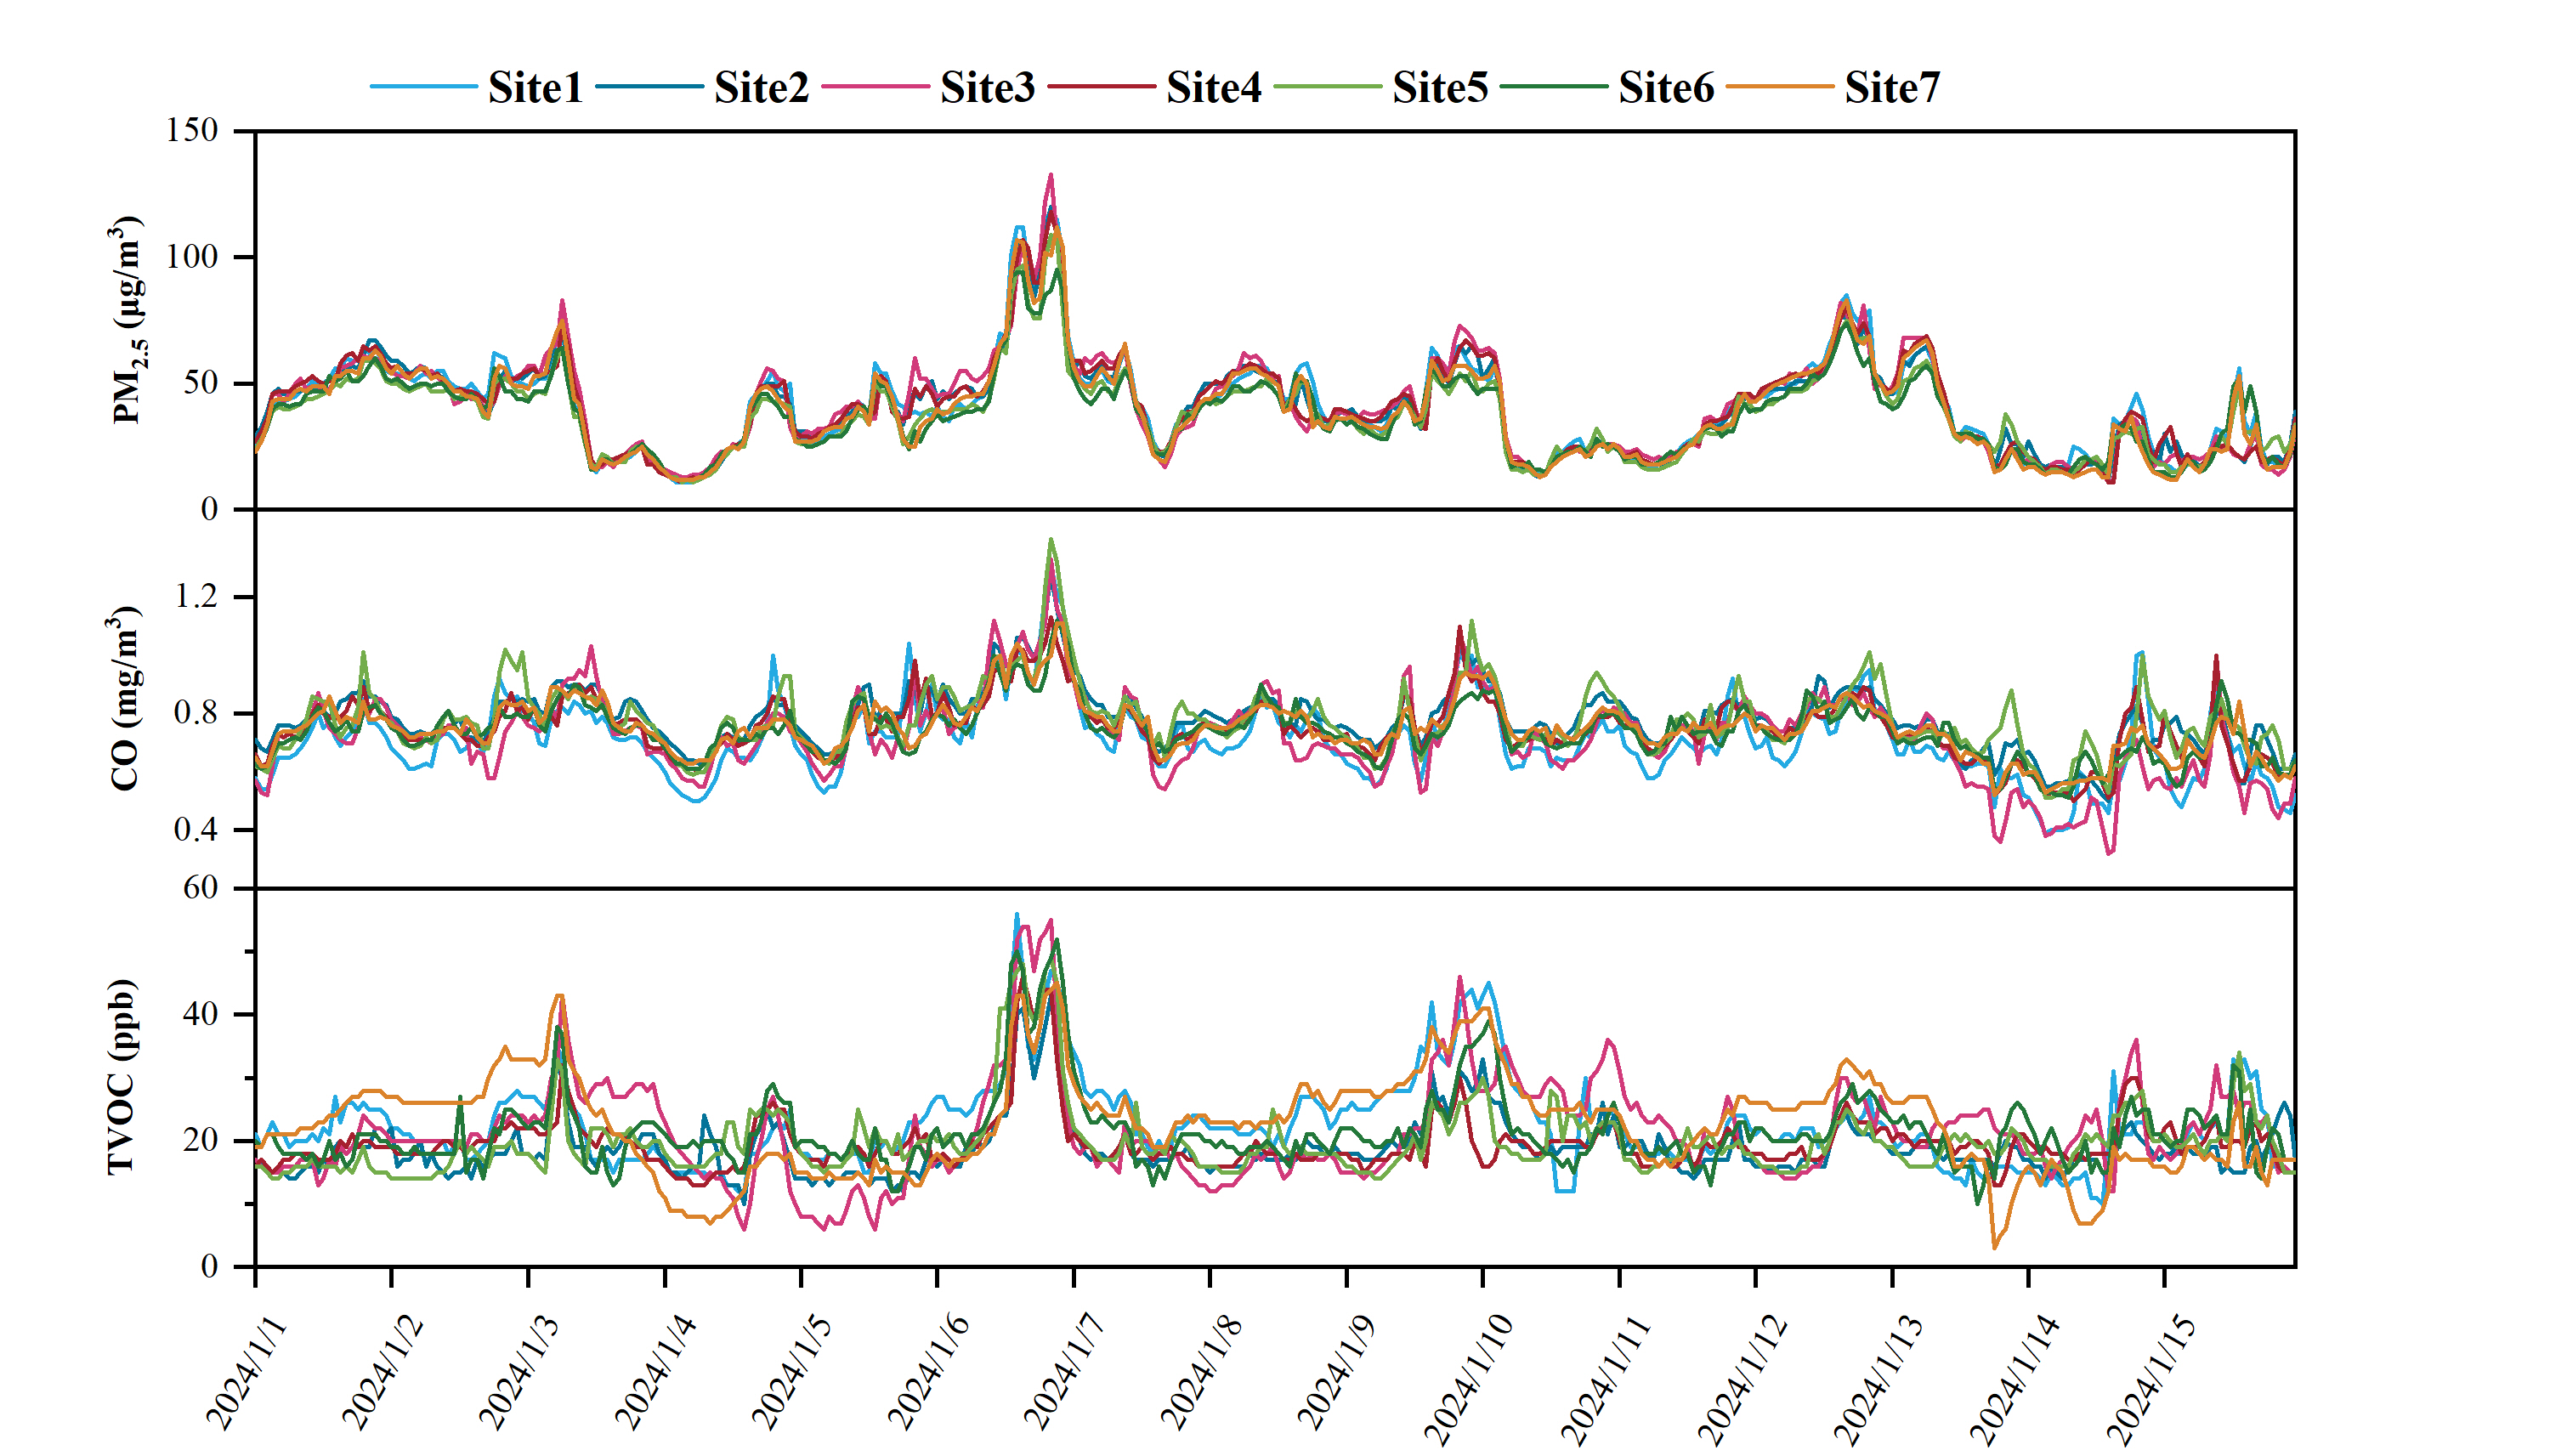
The graph below shows time series of PM2.5, CO and TVOC, measured at multiple sites by different instruments within a large air quality network in an urban environment. It can be seen that, when the concentrations of PM2.5 and CO increase, suggesting a regional accumulation of pollutants, the measured TVOC by individual PID sensors also exhibit simultaneous enhancement. This "indirectly" shows that PID sensors can capture regional TVOC concentration change in the range of 10 - 40 ppb reasonably well.
Non-dispersive Infrared (NDIR) CO2 Sensor


● CO2 is the most important greenhouse gas and also one of the major pollutants in the indoor environment. Combining measurement data with numerical models and through the Baysian inference technique, high spatiotemporal resolution CO2 data can not only be used to derive information about CO2 sources and sinks at fine scales, but also to determine the emission factors (EFs) of atmospheric pollutants (calculated as the ratio of the concentration of the pollutant to that of the coemitted CO2). Traditional CO2 sensors based on NDIR however has a measurement accuracy lower than (30 ppm ± the measured concentration), which is much worse than the typical 2 ppm accuracy required by inventory inversion or determination of EFs;
● We have compared data from our improved NDIR sensor with that from the Picarro G2401 high-accuracy cavity ringdown spectrometer for outdoor CO2 measurmeent. As shown in the above figure, good agreement can be found for hourly data from the two techniques;
● Some sensors may still show 1-3 ppm monthly drift of their baselines, which can be corrected for by injecting known amounts of standard gas.
Accurate data

The graph above shows a comparison of PM2.5, PM10, and PM2.5-10 monitoring between Cambri's atmospheric monitoring micro-station and instruments based on national standards. The results indicate that Cambri's equipment demonstrates good consistency with standard stations under various environmental conditions (temperature 0 °C to 40 °C, relative humidity 15.9% to 100%).

Sep.2021, sewage treatment plant in XX city, Jiangsu.
We have deployed three atmospheric environment monitoring micro station (numbered as 1098, 1100 and 1116) and compared their data with standard device using Federal Reference Methods. Parameters include typical atmospheric pollutants like PM10, PM2.5, CO, NO2, O3 and NO. The temperature and relative humidity intervals are 23.5~43.6 ℃, 15.9%~100% RH.
As shown in the figure above, three micro stations produce data highly matched stand device’s data. The correlation coefficient on PM2.5, PM10, O3, NO2, CO both exceed 0.98, while the coefficient on NO is around 0.9. Note that the NO data produced by standard device on Sep.10th-11th are inaccurate with negative readings.

Analyses reveals that micro stations can operate under various temperature and humidity conditions. All three micro stations provide highly paralleled data which matched standard stations’, while the relativity for particles and ozone is close to 1.

As shown in the figure above, the average value, median, lower and upper percentile of pollutant concentration are very similar between micro station and standard device, which proves that micro station could accurately measure the overall pollution condition.
This device is capable of measuring 8 typical air pollutants (PM1, PM2.5, PM10, CO, NO2, SO2, O3 and CO2), important photochemical and/or secondary aerosol precursors (NO and TVOC), 7 meteorological parameters (air temperature, relative humidity, atmospheric pressure, wind speed, wind direction, illumination and rainfall intensity), and environmental noise (Lp(A,C,Z), Leq, LN (5, 10, 50, 90, 95…), Lmax, Lmin, SD, Ld, Ln and noise spectrum, all at class 1 compliant level) simultaneously.
When equipped with high-performance edge computing chips, device can also run neural network based auto-recognition of the type of the recorded excessive noise clips (categorized into e.g. vehicle passage noise, vehicle horn, construction site noises, and natural sounds such as wind, insects chirping or birds singing etc.), as well as calculate noise annoyance level.
Other features
● 4G wireless data transmission to cloud database, followed by processing, analysis and visualization of measurement data on dedicated client data platform;
● Internal battery (UPS) ensures no data disruption when external power is cut temporarily;
● Internal memory can store >1 year of measurement data when wireless connection is lost, which are then uploaded to the server when the connection is resumed;
● Data quality control (QC): we maintain a professional data QC team and a well-established QC system, to ensure high standards of data quality and timely reply to any customer inquiries.