Current Location:Home>Product & Technology>Atmospheric Pollution Monitoring>Portable atmospheric monitoring station
Portable atmospheric monitoring station
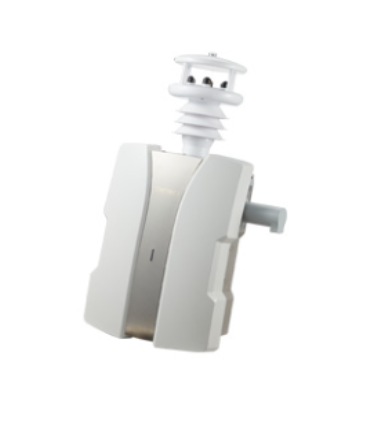
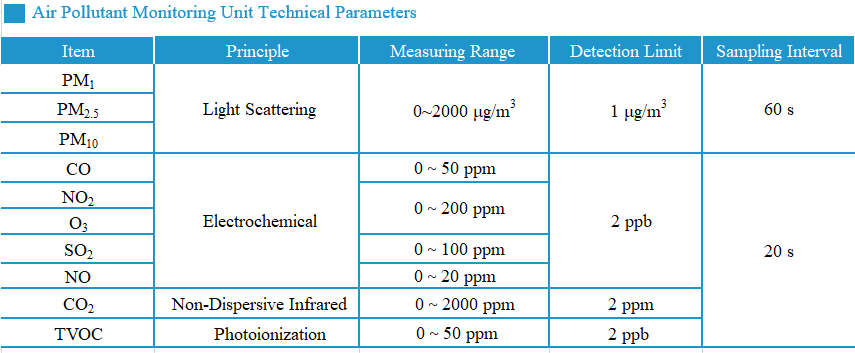
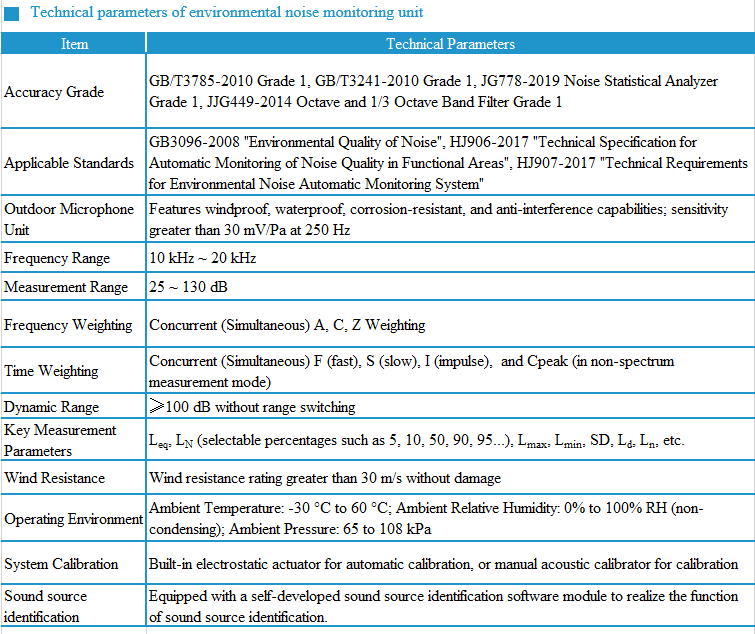
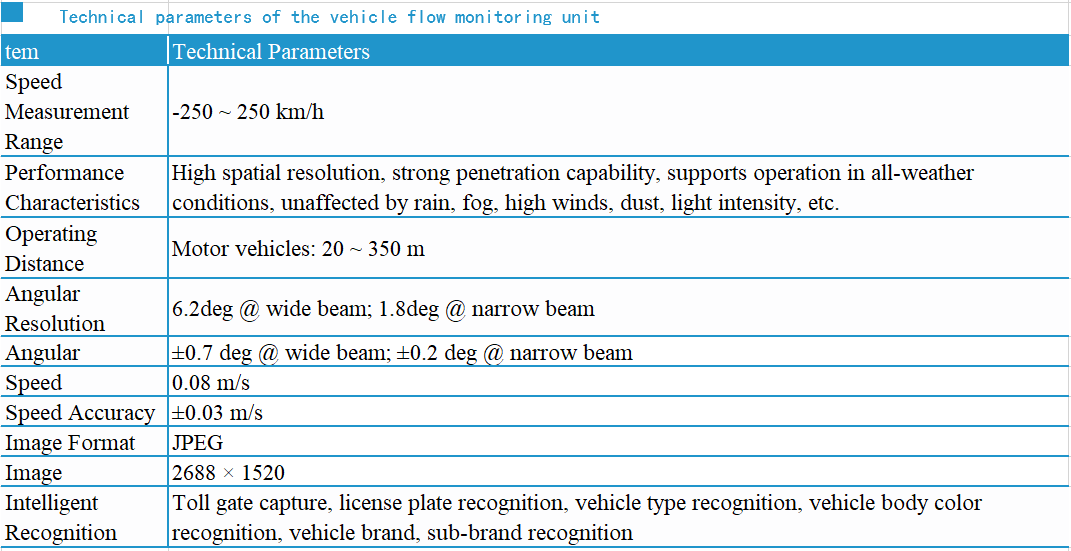
The Cambri AER2-series portable monitoring station incorporates multiple sensors to measure particulate masses (PM1/PM2.5/PM10) and their size distributions (0.33 — 40 μm, 24 size bins), typical gaseous pollutants (CO/NO2/O3/SO2), NO, the greenhouse gas and typical combustion product CO2, TVOC (isobutylene equivalent at 10.6 eV ionization), noise (Class 1- or 2- compliant, selectable), illumination, rain intensity, air temperature/relative humidity, atmospheric pressure. and wind speed and direction, making it well-suited for building high-density atmospheric monitoring networks.
- Product Parameters
- Product Quality Control
- Product Advantages

Electrochemical Gas Sensors
● In electrochemical gas sensors using liquid electrolytes, gas oxidation/reduction occurs on the liquid-solid interface on electrode surfaces. When ambient temperature and relative humidity change, the interfacial capacitor charges or discharges due to the release or absorption of water vapour by the electrolyte, generating a non-Faradaic current that is unrelated to gas reactions, which appears as though the sensor reading is affected by the fluctuation of environmental conditions (Farquhar et al., ACS Sensors, 6, 1295, 2021). Nowadays, gas sensors reaching a precision of part-per-billion (ppb) level are commercially available, but it has remained a tough issue as to how to remove the temperature and relative humidity related interference signals;
● We have proposed, for the first time, a temperature and humidity subtraction algorithm based on "First Principles" (Ouyang, ACS Sensors, 5, 2742, 2020), which can fully eliminate the drift in sensor readings caused by temperature and humidity variations.
Particulate Matter (PM) Sensor
● PM sensors in our devices count individual particles based on single scattering events, and PM1、PM2.5 and PM10 are then calculated by summing their masses up rather than inferred from an overall scattering intensity by the particle ensemble - fewer assumptions are therefore needed which helps to reduce uncertainties;
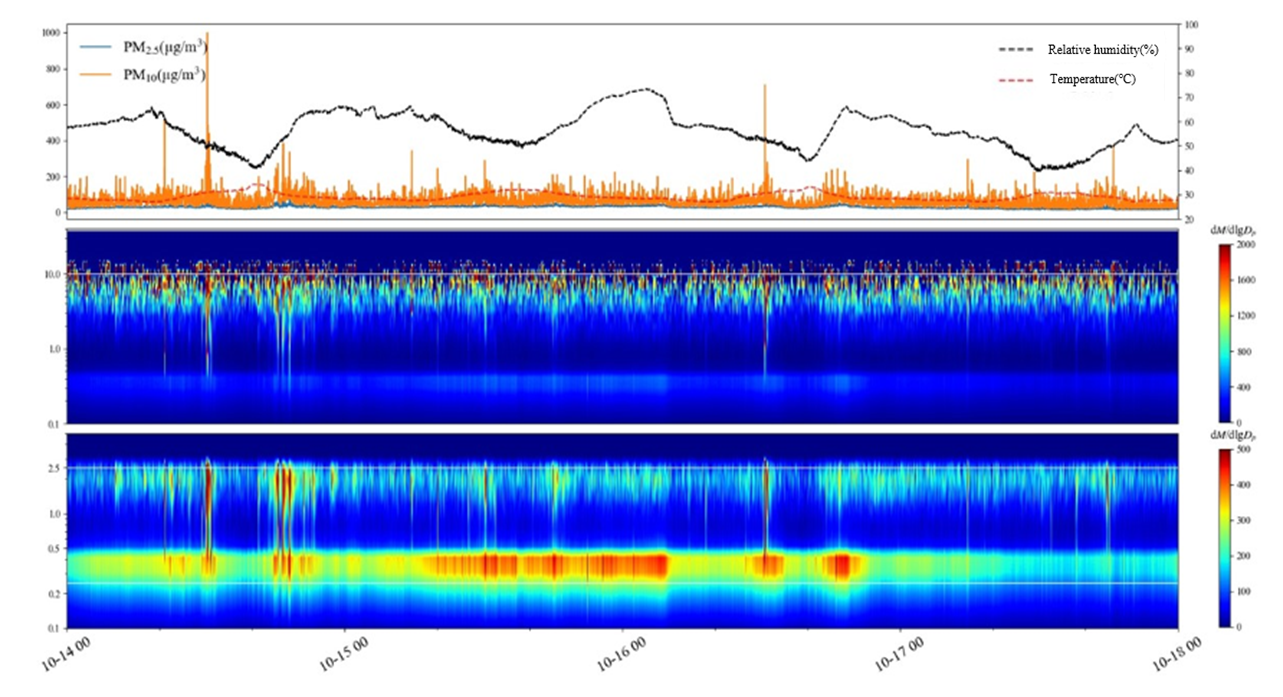
● Since individual particles were counted, our measurements can also provide PM mass distribution spectrum between 0.35 - 40 µm, 24 size bins (see the two lower graphs above), which can help to identify e.g. the different sources of primary particles or to observe the evolution of sizes of the secondary ones;
● Sensors are equipped with an inlet heater which dynamically adjusts its level of heating based on ambient relative humidities. This not only ensures that particles are dried before they are detected, but also avoids unnecessary and potentially excessive heating that may lead to evapouration of semi-volatile components in the particles, and saves power;
● Sensors are also equipped with a heating jacket that warms up the sensor body when ambient tempearture is low, making sure that the laser diodes and photon sensors would function properly.
Photoionization TVOC Sensor

● Owing to their low noises, TVOC sensors based on the photoionization detection (PID) can have superior sensitivities with their measurement precision reaching down to 1 ppb or lower levels. However, in the field environment, especially that with high relative humidities, raw signals of this type of sensors are often T and RH induced drifts rather than that from VOC photoionization - this is best shown by the grey curve corresponding to the raw signal readings of the "ordinary" PID sensor in the above lower figure, most notably at RH > 80% when the sensor output voltage rose simultaneously and non-linearly with the increase of RH;
● Our patented technique however suppresses the T and RH induced sensor drifts, thereby decoupling the trend of the sensor raw reading and those of T and RH, as shown by the red curver in the above lower figure for the "modified" TVOC sensor;

Furthermore, we compared the TVOC concentration (isobutylene equivalent) measured by the photoionization detector with the weighted concentration of VOC components based on gas chromatography-flame ionization detector (GC-FID) (calculated according to the response coefficients of VOCs to 10.6 eV photoionization, PID Correction Factors), and the results are shown in the figure above.
●Both methods show good consistency in both the low concentration range (10-20 ppb) and the high pollution range (>200 ppb), indicating that the PID sensor can accurately monitor TVOC concentrations in varying outdoor temperature and RH conditions;
● We believe it is fair to claim that measurement results by the PID sensors have effectively eliminated the impacts of T and RH, and therefore can avoid the unrealistic, high reading values under high-humidity conditions. Meanwhile, sensor measurements have higher temporal resolution and can capture VOC concentration change in seconds;
● Our selected sensors have sensitivity loss of <20% after >1 year continous running in the moderately polluted industrial park environment (peak TVOC concentration >400 ppb), suggesting that the sensors are resistant towards pollution and have stable UV lamp outputs across this time scale.
Non-dispersive Infrared (NDIR) CO2 Sensor


● CO2 is the most important greenhouse gas and also one of the major pollutants in the indoor environment. Combining measurement data with numerical models and through the Baysian inference technique, high spatiotemporal resolution CO2 data can not only be used to derive information about CO2 sources and sinks at fine scales, but also to determine the emission factors (EFs) of atmospheric pollutants (calculated as the ratio of the concentration of the pollutant to that of the coemitted CO2). Traditional CO2 sensors based on NDIR however has a measurement accuracy lower than (30 ppm ± the measured concentration), which is much worse than the typical ~2 ppm accuracy required by inventory inversion or determination of EFs;
● We have compared data from our improved NDIR sensor with that from the Picarro G2401 high-accuracy cavity ringdown spectrometer for outdoor CO2 measurmeent. As shown in the above figure, good agreement can be found for hourly data from the two techniques;
● Some sensors may still show 1-3 ppm monthly drift of their baselines, which can be corrected for by injecting known amounts of standard gas.
Accurate data
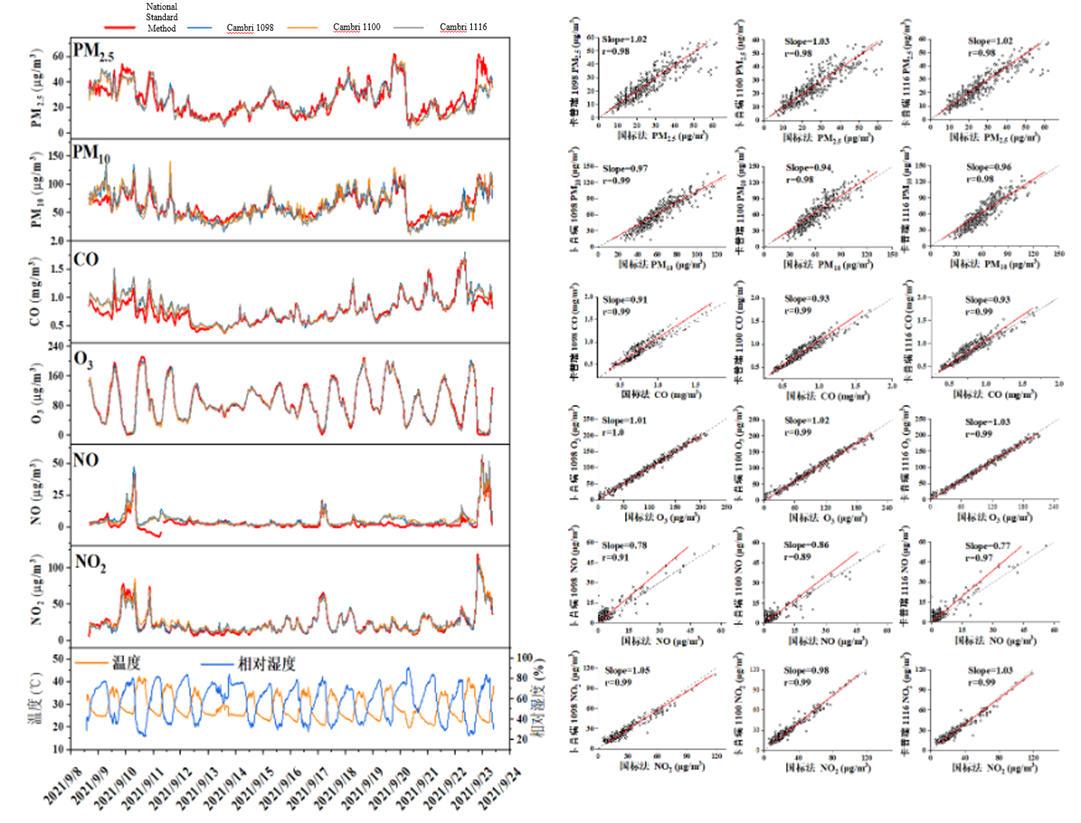
Sep.2021, sewage treatment plant in XX city, Jiangsu.
We have deployed three atmospheric environment monitoring micro station (numbered as 1098, 1100 and 1116) and compared their data with standard device using Federal Reference Methods. Parameters include typical atmospheric pollutants like Pm10, Pm2.5, CO, NO2, O3 and NO. The temperature and relative humidity intervals are 23.5~43.6 ℃, 15.9%~100% RH.
As shown in the figure above, three micro stations produce data highly matched stand device’s data. The correlation coefficient on PM2.5, Pm10, O3, NO2, CO both exceed 0.98, while the coefficient on NO is around 0.9. Note that the NO data produced by standard device on Sep.10th-11th are inaccurate with negative readings.

Analyses show that micro stations can operate effectively across a range of temperatures and humidities. The data from all three micro stations closely align with those from standard stations, exhibiting a near-perfect correlation for both particulate matter and ozone.

As shown in the figure above, the average value, median, lower and upper percentile of pollutant concentration are very similar between micro station and standard device, which proves that micro station could accurately measure the overall pollution condition.