By implementing this monitoring plan, real-time monitoring of PM concentration in industrial parks can be achieved to improve air quality within the park. At the same time, provide data support for enterprises and guide them in pollution control. Regularly evaluate the effectiveness of the plan, adjust and optimize it based on the evaluation results, and ensure the continuous effectiveness of the plan.
- Overview
Application cases1:
A case study of multi-point positioning of pollution sources in industrial parks
Case Description:
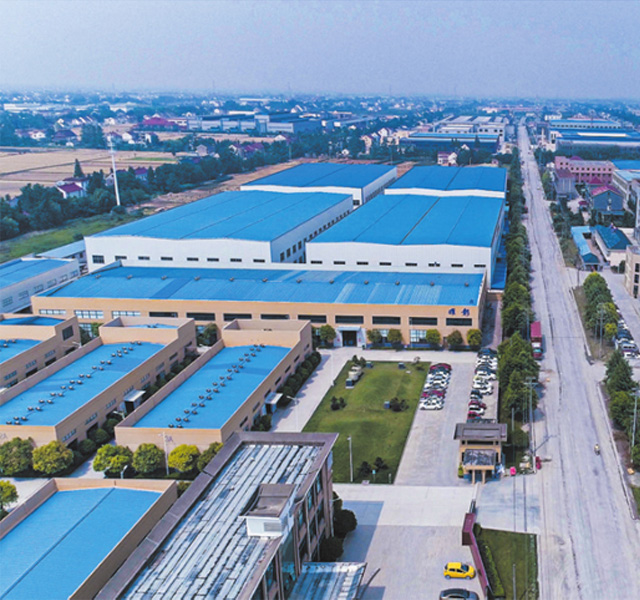
Taking an industrial park in a certain city in Sichuan as an example, an industrial park atmosphere dense monitoring network was installed on the roof of a factory building with exhaust outlets in the industrial park, in order to dynamically grasp the emission of atmospheric pollutants from the exhaust outlets of various enterprises. The purpose is to play a monitoring role in capturing disorderly, hidden, and imperceptible unorganized emissions.
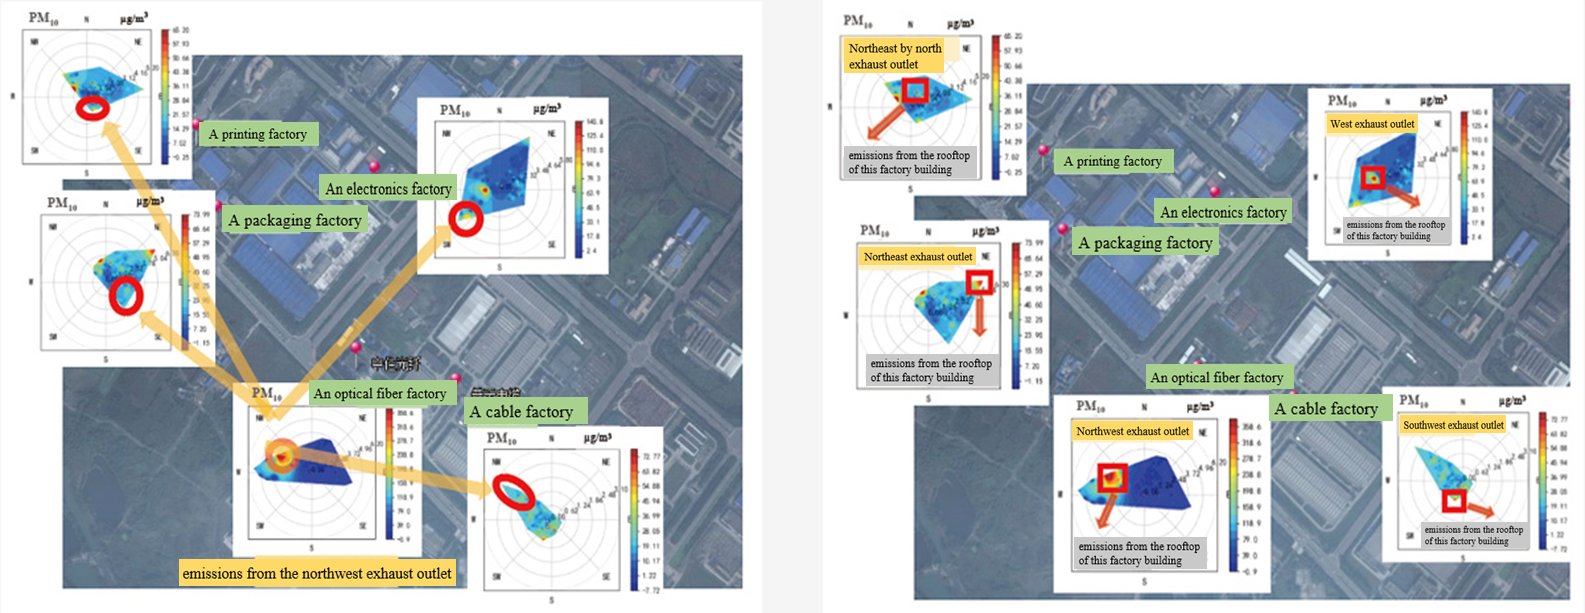
The figure shows the pollution rose of PM10 wind speed and direction in the industrial area. Firstly, it should be noted that the peak PM10 of a certain fiber optic factory exceeded 250μg/m3 on the same day , further combined with wind speed and direction, determine that the pollution source comes from the northwest direction. According to on-site inspections and records, there is an exhaust outlet on the northwest side of the factory roof, so the high concentration of PM10 on that day is related to the exhaust outlet emissions of the chemical fiber plant. Similarly, by combining the position of the exhaust port with the orientation of the high emission hotspots in the wind rose diagram, it is found that the orientation of the high emission hotspots of particulate matter in a certain cable factory, packaging factory, printing factory, and electronics factory are mainly affected by their respective exhaust ports.
There is mutual influence between different exhaust ports, so multi-point data/charts can assist each other to achieve more accurate traceability and positioning functions. On that day, when a certain chemical fiber factory was heavily polluted with PM10, other nearby points captured the spread of pollution from the direction of the factory. When the wind direction is northwest, a weak signal from the emission impact of the chemical fiber plant was captured in the wind rose diagram of a cable factory that is closest (244 meters); When the wind direction is southeast, pollution signals have been captured by a printing factory and a packaging factory in the northwest direction of the chemical fiber factory; When the wind direction is southwest, a certain electronic factory located 406 meters northeast captured a pollution signal. Therefore, it can be determined that the chemical fiber factory is the main particle pollution enterprise in the region and should be focused on control.
Application case 2:
Analysis of PM pollution sources in industrial parks
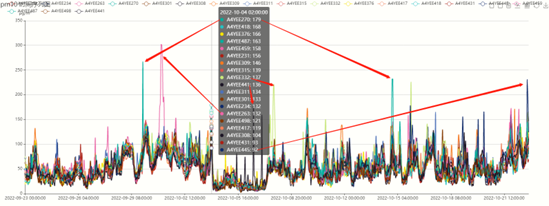
Trend diagram of PM2.5 hours in microstation
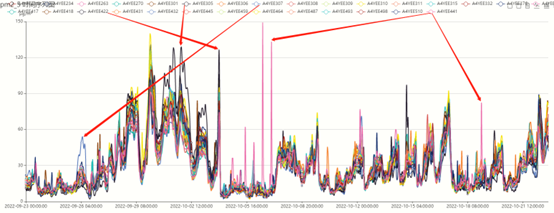
Trend chart of PM10 hours (microstation with burst high value <300 μg/m3)
The trend of pollution in the monitored areas of the micro-stations is basically the same, the daily average concentration is not different, and the spatial distribution of particulate mass is relatively uniform. PM pollution mainly comes from the local emission of PM, especially the sudden emission of PM10.
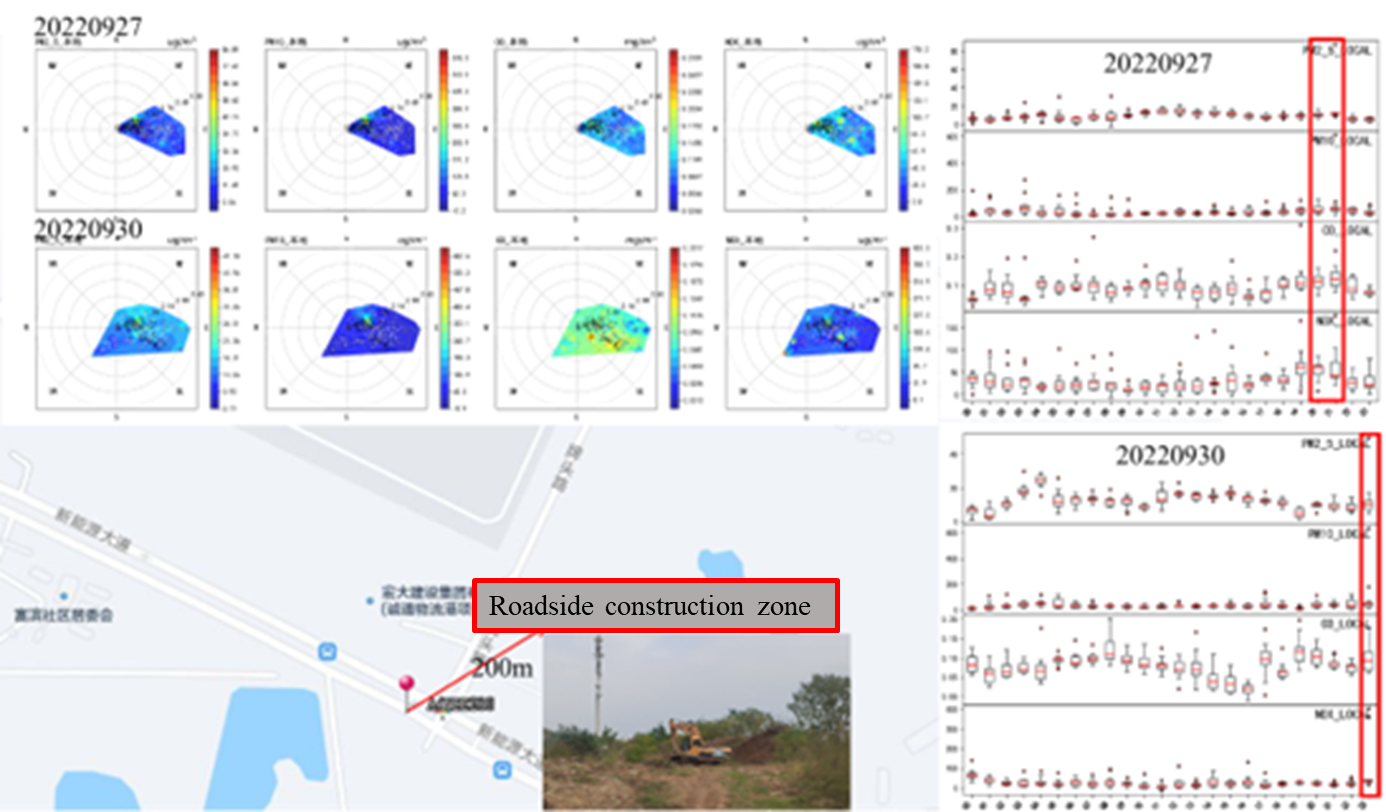
There were high PM emissions at this location on September 27th and September 30th, with particularly significant increases in PM10 concentrations. The PM2.5 concentration exceeded 50 μg/m3 and the PM10 concentration surpassed 600 μg/m3. Between 20:00 and 21:00 on September 27th, and at 23:00 on September 30th, there was a simultaneous increase in CO, NOx, and PM, among which NOx showed a substantial increase compared to CO, with a ratio of ∆CO:∆NOx being less than 8:1. Therefore, based on field observations, it is speculated that the pollution concentrations at this location are primarily caused by road sources, and the impact of roadside construction on elevating pollutant concentrations cannot be ruled out.